


65%
Decrease in effluent ammonia
Year over year, compared with the previous year without nanobubbles
Restaurant sanitizers inhibited nitrification, causing repeated total nitrogen permit exceedances. The XTB 100 restored full nitrification, and the facility has stayed in compliance without quat-blocking chemicals.

Year over year, compared with the previous year without nanobubbles
Effluent TN fell 33% year over year, from a 4.8 mg/L average without nanobubbles to 3.2 mg/L with nanobubbles.
The plant achieved complete, stable nitrification for the first time in years, despite high QAC influent loads.
Moleaer Nanobubble Technology eliminated the need for quat-blocking chemicals at the plant.
The plant has been in compliance with stable operations since the nanobubble installation.
Year-over-year results compare plant data with the previous year without nanobubbles. Results are specific to this facility and are not a guarantee of performance.
In March 2024, Woodard & Curran integrated a Moleaer XTB 100 into the existing treatment process to evaluate nanobubble pretreatment without quat blockers. The system treated influent to the first rotating biological contactor (RBC) and could recirculate flow to the equalization basins.
After 90 days of operation, Derby St. Shops made the installation permanent.
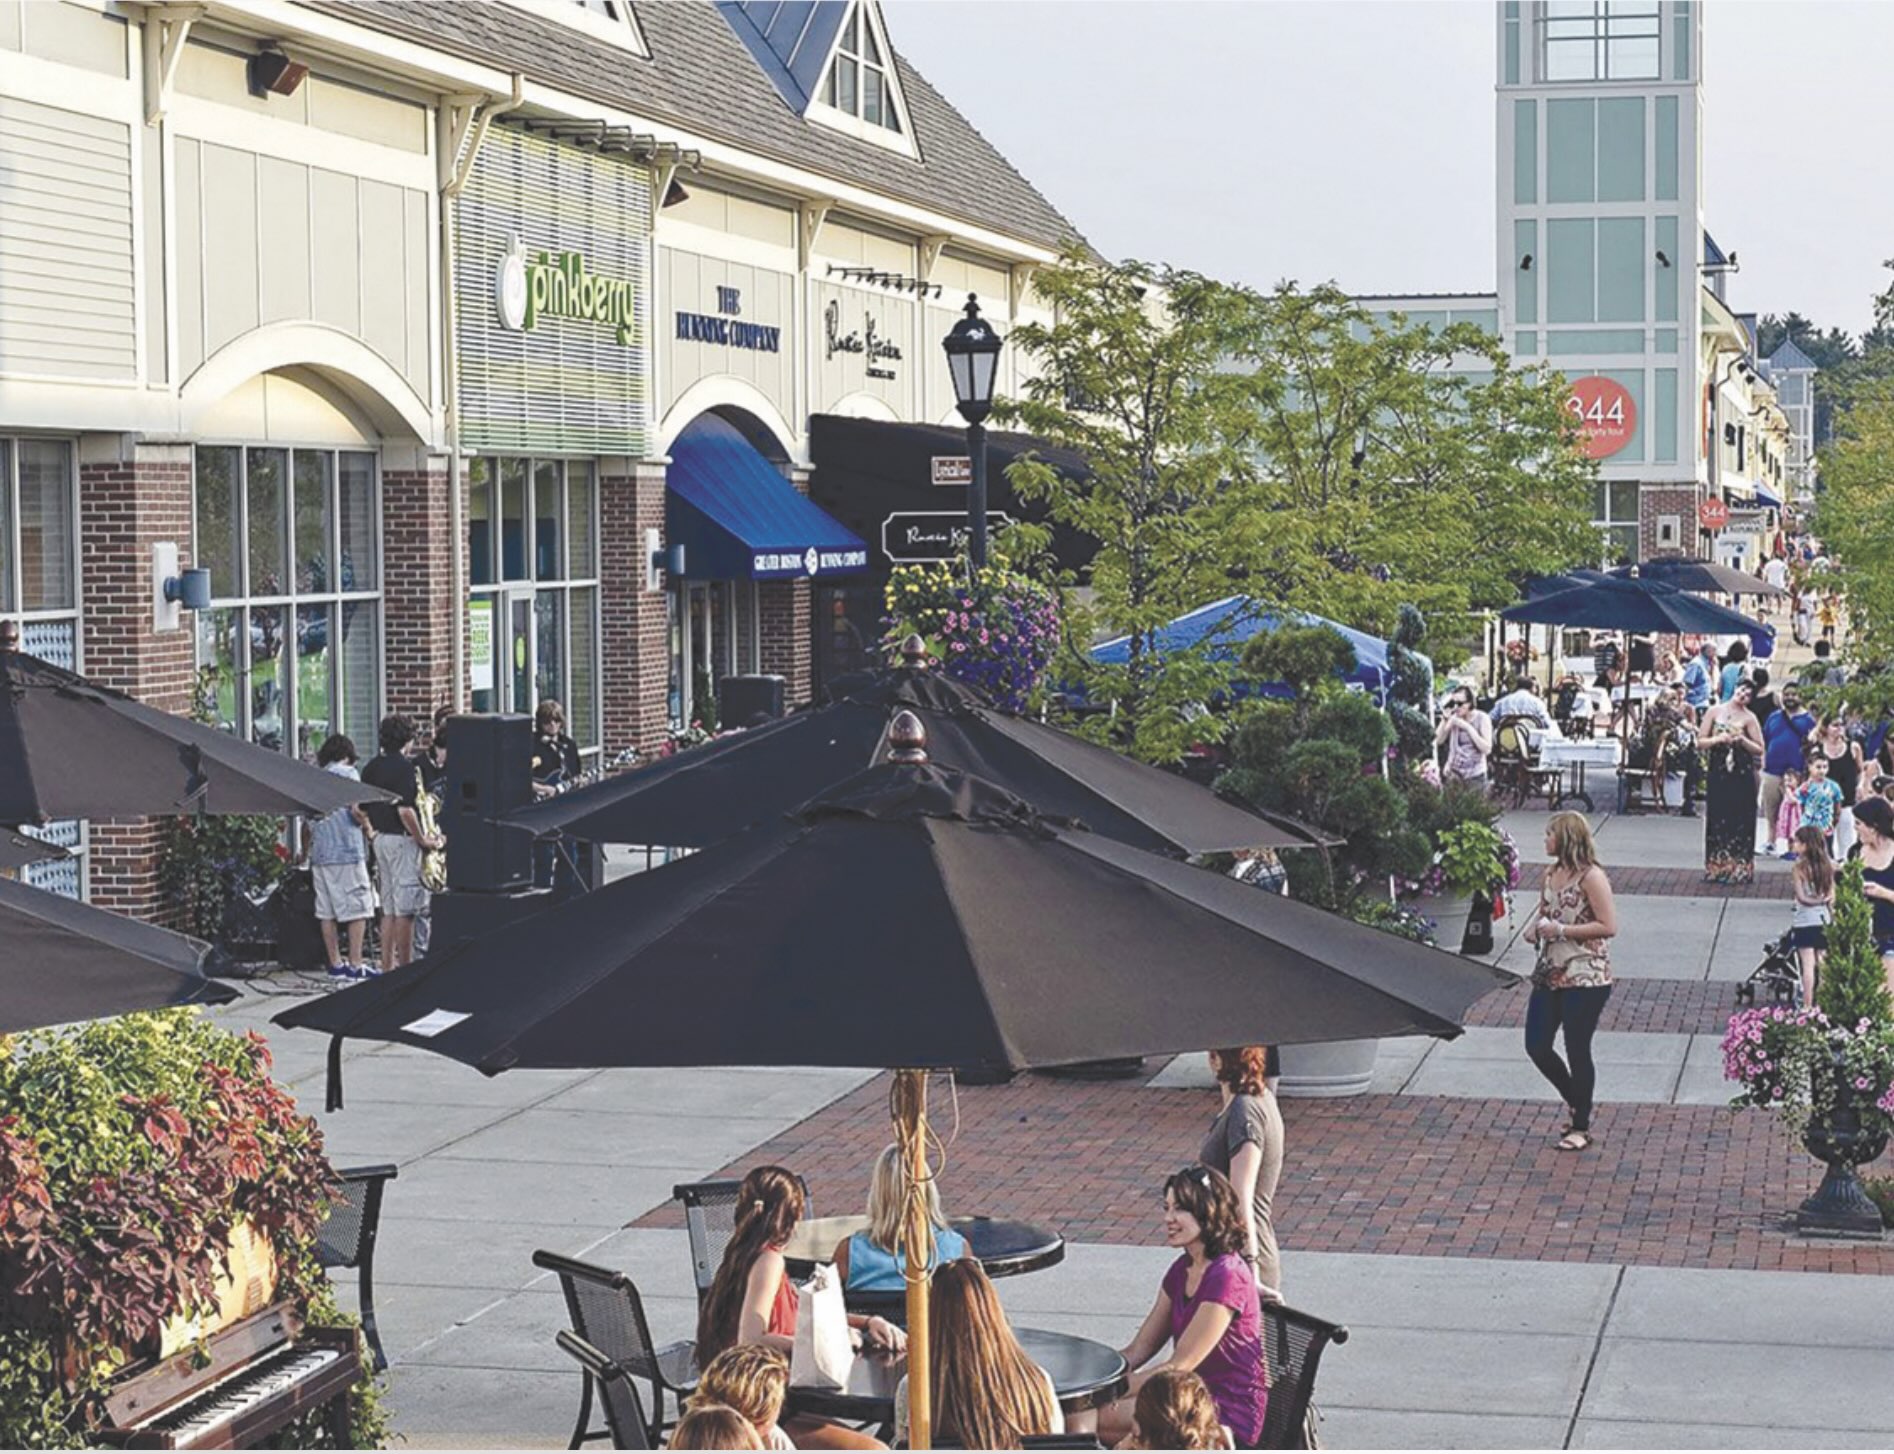
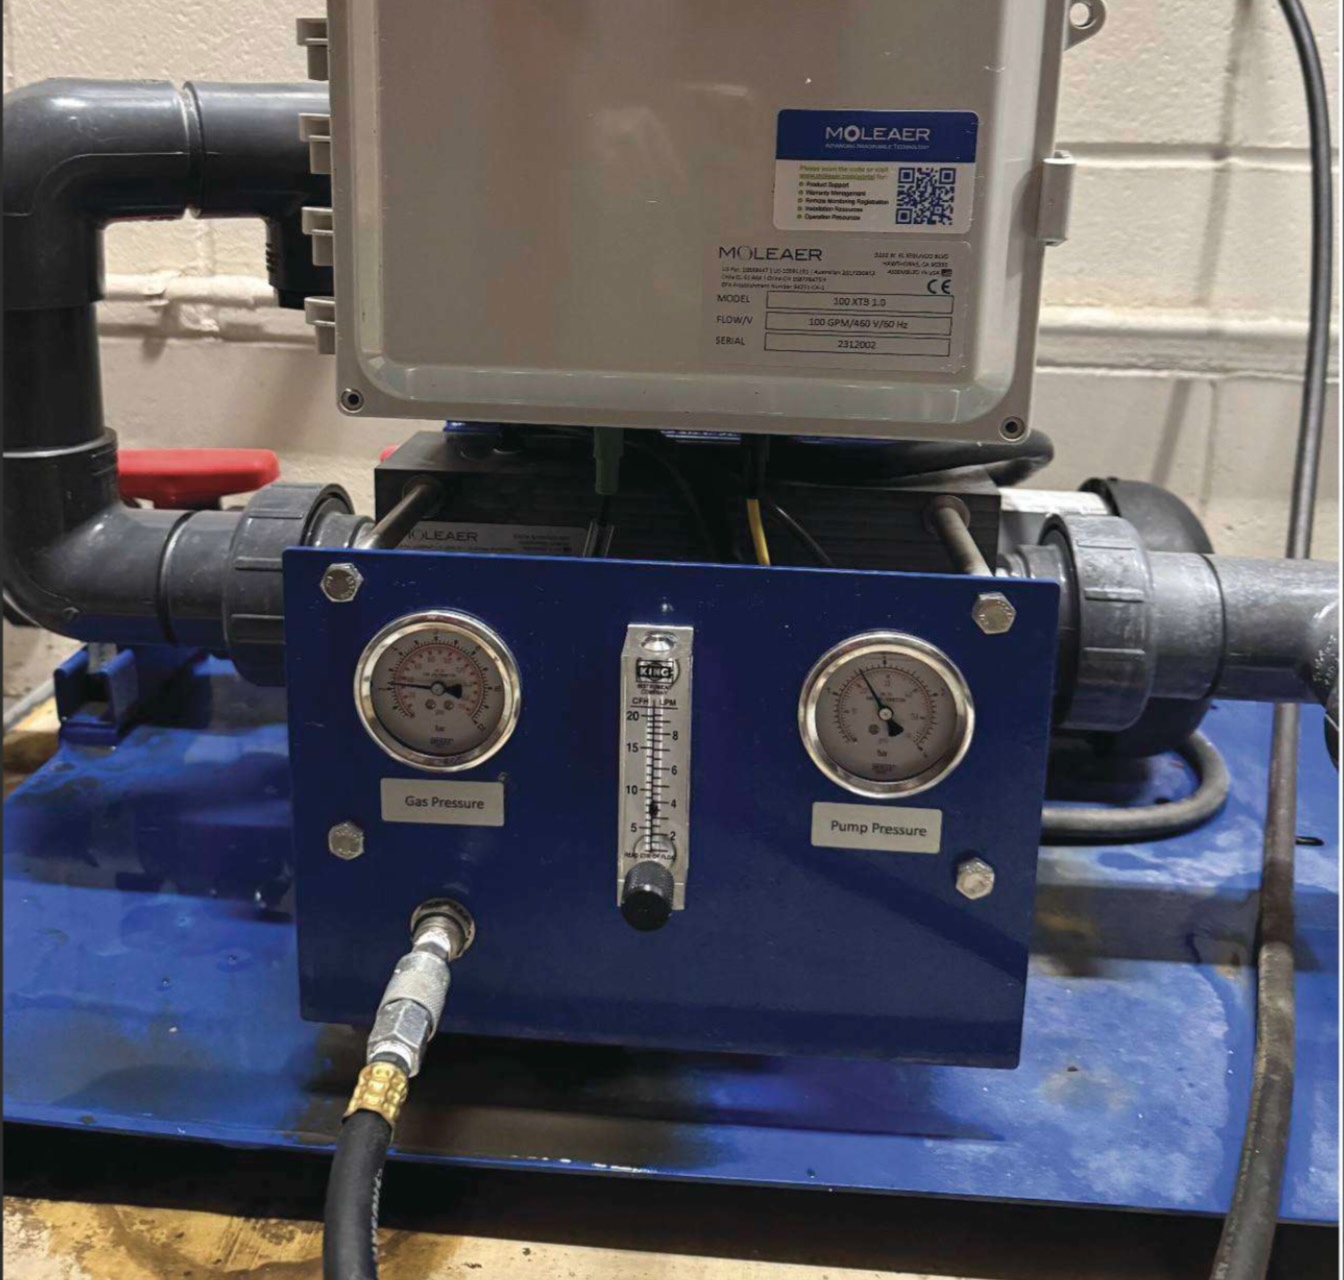
Woodard & Curran partnered with Moleaer to use nanobubbles as a chemical-free alternative to quat blockers. In March 2024, the team began a 90-day trial with a Moleaer XTB 100 nanobubble generator. It integrated with the existing infrastructure.
The system was installed at the influent of the first Rotating Biological Contactor (RBC). It could also recycle back to the Flow Equalization basins for enhanced treatment. After the trial’s results, Derby St. Shops made the Moleaer nanobubble generator a permanent installation.
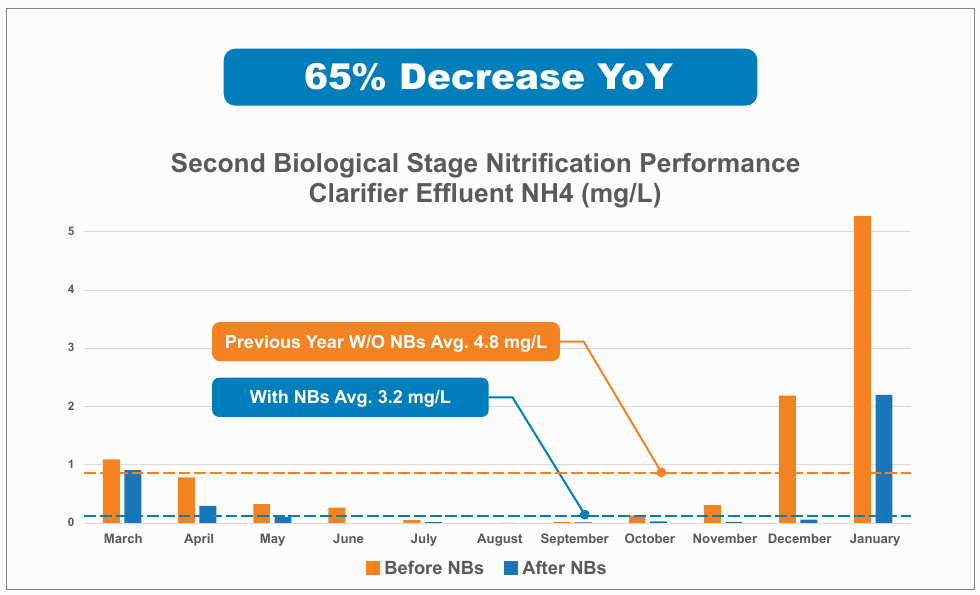
Explore Moleaer’s XTB 100The chart tracks second biological stage nitrification performance as clarifier effluent NH4 (mg/L), month by month from March to January. Orange bars show the previous year before nanobubbles. Blue bars show results after nanobubbles.
Effluent ammonia was 65% lower year over year with nanobubbles. The biggest gap shows in December and January, when ammonia peaked in the previous year.
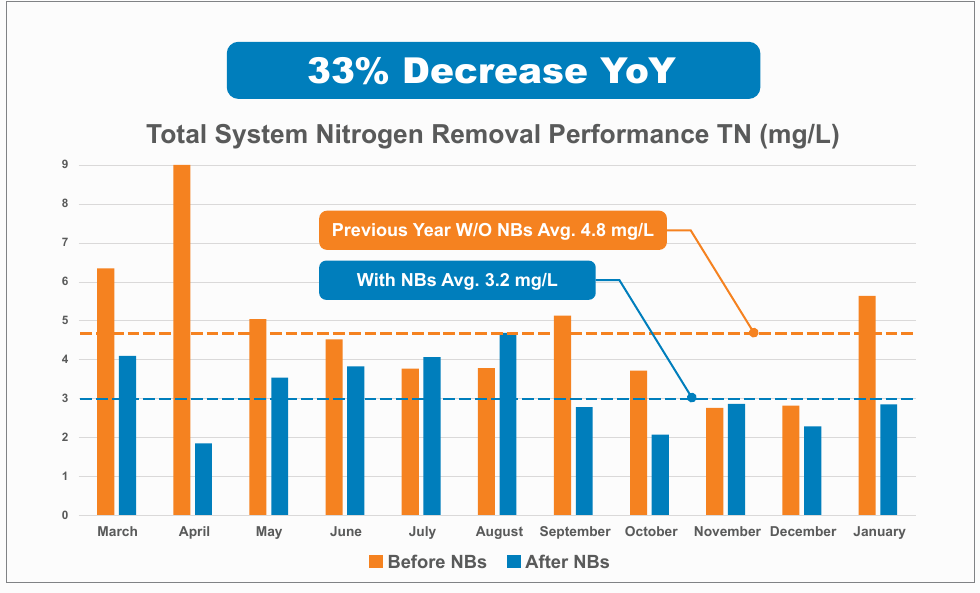
The chart tracks total system nitrogen removal performance as TN (mg/L), month by month from March to January. It compares the previous year without nanobubbles to the year with nanobubbles.
Average TN fell from 4.8 mg/L without nanobubbles to 3.2 mg/L with nanobubbles. That is a 33% decrease year over year.
Derby St. Shops now has full nitrification and consistent TN permit compliance without quat-blocking chemicals. The plant also recovered process stability during toxicity events.
The chemical-free approach removes concerns about additive impacts. It also cuts ongoing operating costs because the plant no longer buys chemicals. For plants facing nitrification inhibition from QACs, this case shows a practical alternative to chemical treatment.
Download the full Derby St. Shops case study for the complete results, charts, and implementation details.
Speak with a Moleaer wastewater expert about QACs, nitrification, and TN permit compliance at your plant.
Talk to a wastewater expert →